Modern Portfolio Theory - Part 2
June 21, 2021 by Chris
 python
Previously in Modern Portfolio Theory - Part 1 we located the global minimum variance portfolio (GMV) on the Efficient Frontier. In Present Value & the Funding Ratio we showed how inflation drags down the real return of an investment.
While GMV would pose the minimum (estimated) risk for an investor, it might not be the one that outperforms inflation. In addition to that, government bonds are considered very low risk and yield an annual return which is the profit for the investor. When constructing a portfolio of assets that are riskier, the expectation on return should be higher. A return that surpasses inflation and bond returns should be the goal.
Quoting from Investopedia - Risk-Free Rate Of Return
The risk-free rate of return is the theoretical rate of return of an investment with zero risk. The real risk-free rate can be calculated by subtracting the current inflation rate from the yield of the Treasury bond matching your investment duration.
Back to the wikipedia article on Modern Portfolio Theory we notice some pretty interesting aspects.
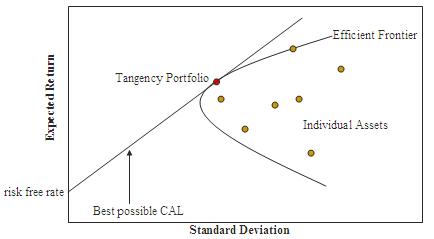
- There can be a portfolio which yields the risk-free rate and has ~0 standard deviation. It is with minimal risk. That can be a government bond/bill/note for example.
- When we start mixing low risk assets (like bonds) with risky assets (like stocks) the return increases but it cannot cross above a line. That, is presented in the graph above with the
Best possible CALline which is the Efficient Frontier of the portfolios that hold both risky and non-risky assets. It is called Capital Allocation Line (CAL) or Capital Market Line (CML). - There is a point where the line touches the risky asset portfolios Efficient Frontier (
Tangency PortfolioorMaximum Sharpe Ratio Portfolio).
where
- = Portfolio return
- = Risk free rate
- = Portfolio standard deviation
The point in the graph that gives us the best possible return for every unit of risk we take is called Maximum Sharpe Ratio Portfolio.
Package Installation
%%capture
%pip install yahoofinancials
from yahoofinancials import YahooFinancials
import pandas as pd
import matplotlib
import matplotlib.lines as mlines
import matplotlib.pyplot as plt
import dateutil.parser
import numpy as np
from scipy.optimize import minimize
Helper Functions
def retrieve_stock_data(symbol, start, end):
    """Fetches daily stock prices from Yahoo Finance"""
    json = YahooFinancials(symbol).get_historical_price_data(start, end, "daily")
    df = pd.DataFrame(columns=["adjclose"])
    for row in json[symbol]["prices"]:
        d = dateutil.parser.isoparse(row["formatted_date"])
        df.loc[d] = [row["adjclose"]]
    df.index.name = "date"
    return df

def arithmetic_returns(S):
    """Returns the arithmetic returns. (price_today - price_yesterday)/price_yesterday"""
    return S.pct_change().dropna()

def annualize_rets(r, periods_per_year):
    compounded_growth = (1+r).prod()
    n_periods = r.shape[0]
    return compounded_growth**(periods_per_year/n_periods)-1

def portfolio_return(weights, returns):
    return weights.T @ returns

def portfolio_volatility(weights, covariance_matrix):
    return (weights.T @ covariance_matrix @ weights)**0.5

def generate_returns_dataframe(symbols_list, d_from="2020-01-01", d_to="2021-01-01"):
    """Generates a DataFrame with daily returns for a list of Symbols."""
    returns = pd.DataFrame()
    for symbol in symbols_list:
        stock_prices = retrieve_stock_data(symbol, d_from, d_to)
        rets = arithmetic_returns(stock_prices).dropna()
        rets.columns = [symbol]

        if returns.empty:
            returns = rets
        else:
            returns = returns.merge(rets, left_index=True, right_index=True)
    return returns

def global_minimum_variance(returns, covariance_matrix):
  """Returns the weights of the GMV portfolio"""
  n = returns.shape[0]
  weights_sum_to_1 = {
      'type': 'eq',
      'fun': lambda weights: np.sum(weights) - 1
  }
  result = minimize(portfolio_volatility, np.repeat(1/n, n), args=(covariance_matrix, ),
                    method="SLSQP", options={'disp': False},
                    constraints=(weights_sum_to_1), bounds=((0.0, 1.0),)*n)
  return result.x

def efficient_frontier_dataframe(annualized_returns, covariance_matrix):
  # first we construct 10 pairs of weights like [(0.1,0.9), (0.2,0.8) ...]
  weights = [np.array([w, 1-w]) for w in np.linspace(0, 1, 10)]

  # then we calculate the return of the portfolio for each pair of weights
  portfolio_returns = [portfolio_return(w, annualized_returns) for w in weights]

  # and the volatility of the portfolio for each pair of weights
  vols = [portfolio_volatility(w, covariance_matrix) for w in weights]

  return pd.DataFrame({
      "Return": portfolio_returns,
      "Volatility": vols,
      "weights": weights
  })

def print_weights_on_graph(ax, x, y, val):
  """Adds the weight on the efficient frontier"""
  a = pd.concat({'x': x, 'y': y, 'val': val}, axis=1)
  for i, point in a.iterrows():
    prettified_p = f"({round(point['val'][0], 2)},{round(point['val'][1], 2)})"
    ax.text(point['x'], point['y'], prettified_p)

def plot_custom_legend():
  """Adds a custom legend for the different points on the graph"""
  blue_star = mlines.Line2D([], [], color='blue', marker='*', linestyle='None',
                            markersize=10, label=f"MSR")
  red_square = mlines.Line2D([], [], color='red', marker='s', linestyle='None',
                            markersize=10, label=f"GMV")
  purple_triangle = mlines.Line2D([], [], color='green', marker='^', linestyle='None',
                            markersize=10, label=f"Mix")

  plt.legend(handles=[blue_star, red_square, purple_triangle])
STOCK_SYMBOLS = ['MSFT', 'APT']
returns = generate_returns_dataframe(STOCK_SYMBOLS)
covariance_matrix = returns.cov()
annualized_returns = annualize_rets(returns, 252)
gmv = global_minimum_variance(annualized_returns, covariance_matrix)
Capital Allocation Line & Maximum Sharpe Ratio Portfolio (MSR)
Similar to what we did with the GMV portfolio (in Modern Portfolio Theory - Part 1), we will do with finding the MSR Portfolio. Instead of trying to minimize the volatility, we will maximize the sharpe ratio. To achieve that, we will use the exact same quadratic programming approach and the minimize function from scipy.
However, to turn maximization into minimization, we will do a simple trick! we will minimize the negative value of the sharpe ratio :)
def maximum_sharpe_ratio(returns, covariance_matrix, risk_free_rate):
  """Returns the weights of the MSR portfolio"""
  n = returns.shape[0]
  weights_sum_to_1 = {
      'type': 'eq',
      'fun': lambda weights: np.sum(weights) - 1
  }

  def negative_sharpe_ratio(weights, returns, covariance_matrix, risk_free_rate):
    p_rets = portfolio_return(weights, returns)
    p_vol = portfolio_volatility(weights, covariance_matrix)
    return -(p_rets - risk_free_rate)/p_vol

  result = minimize(negative_sharpe_ratio, np.repeat(1/n, n),
                    args=(returns, covariance_matrix, risk_free_rate),
                    method="SLSQP", options={'disp': False},
                    constraints=(weights_sum_to_1), bounds=((0.0, 1.0),)*n)
  return result.x
risk_free_rate = 0.03
msr = maximum_sharpe_ratio(annualized_returns, covariance_matrix, risk_free_rate)
msr
array([0.75444897, 0.24555103])
Plotting GMV, MSR, CAL & Mixed portfolio
# get the efficient frontier as dataframe and plot it
ef = efficient_frontier_dataframe(annualized_returns, covariance_matrix)
ax = ef.plot(x="Volatility", y="Return", style=".-", figsize=(14,7),
             title="2 Asset Portfolio Risk/Return", legend=False)
ax.set_xlim(left=0)
plt.ylabel("Return")

# show the different weights on the efficient frontier
print_weights_on_graph(ax, ef.Volatility, ef.Return, ef.weights)

# find the MSR point and add a marker
rets_msr = portfolio_return(msr, annualized_returns)
vol_msr = portfolio_volatility(msr, covariance_matrix)
ax.plot(vol_msr, rets_msr, 'b*', markersize=10)

# construct and plot the Capital Allocation Line
cal_x = np.arange(0, vol_msr, (vol_msr-0)/100)
cal_y = np.arange(risk_free_rate, rets_msr, (rets_msr-risk_free_rate)/100)
ax.plot(cal_x, cal_y, color="green", linestyle="dashed")

# find the GMV point and add a marker
rets_gmv = portfolio_return(gmv, annualized_returns)
vol_gmv = portfolio_volatility(gmv, covariance_matrix)
ax.plot(vol_gmv, rets_gmv, 'rs', markersize=10)

# locate the Mixed portfolio on CAL that has less risk than the GMV
idx = np.argwhere(np.diff(np.sign(rets_gmv - cal_y))).flatten()
ax.plot(cal_x[idx], cal_y[idx], 'g^', markersize=10)

# Add a custom legend for the markers
plot_custom_legend()
plt.show()

MSR vs. GMV vs. Mixed Portfolio
From the graph above we can pinpoint 3 interesting portfolios:
- The GMV portfolio which depends solely on the covariance matrix.
- The MSR portfolio which depends both on the covariance matrix and the expected returns.
- The Mixed Portfolio which can yield same return as the GMV but with less risk.
So far, we took advantage of the historical data and constructed some portfolios. However, historical returns are no guarantee of future returns. Estimating returns is very difficult and requires experience, deep knowledge of the respective assets, continuous monitoring of the market and much more.
So, which portfolio is best to hold? The answer to that cannot be given with certainty!
GMV does not take into account returns (or estimated expected returns) and thus makes it easier to calculate, but at the same time, constructing the covariance matrix for a long list of assets falls under the well known Curse of Dimensionality problem.
MSR poses the difficulty of estimating expected returns and thus includes increased risk.
The mixed portfolio combines non risky assets with risky assets while lowering the risk. However, the covariance matrix is yet there to calculate.
All in all, each portfolio includes risk, which we call model risk. There are several ways to tackle this model risk and I will try to address them in future articles.
Until then, enjoy!

