Modern Portfolio Theory - Part 1
April 2, 2021 by Chris
 python
In a previous post about Return & Volatility of a Multi-Asset Portfolio we saw how the correlation of the prices of two assets was a key part to achieving lower volatility than the volatility of the assets' individually. We built a visual proof with just two random assets.
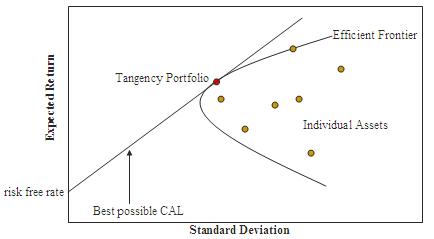
The locus of all frontier portfolios in the mean-variance plane is called Portfolio Frontier.
which is part of Modern portfolio theory (MPT) and according to wikipedia
Modern portfolio theory (MPT), or mean-variance analysis, is a mathematical framework for assembling a portfolio of assets such that the expected return is maximized for a given level of risk. It is a formalization and extension of diversification in investing, the idea that owning different kinds of financial assets is less risky than owning only one type. Its key insight is that an asset's risk and return should not be assessed by itself, but by how it contributes to a portfolio's overall risk and return. It uses the variance of asset prices as a proxy for risk.
Economist Harry Markowitz introduced MPT in a 1952 essay, for which he was later awarded a Nobel Memorial Prize in Economic Sciences; see Markowitz model.
The "two asset" Portfolio Frontier we built in the previous post was done through carefully picking the asset weights and printing the mean-variance graph. Then, we were able to find on the graph which pair of weights was responsible for the minimum volatility portfolio.
We can construct portfolios that have the same variance but different returns. A mean-variance investor would, of course, prefer the portfolio with the highest return. Then, we can see that out of the whole frontier line we are mostly interested for the upper part and disregard any portfolios below. This part of the frontier is called Efficient Frontier since it really represents the most efficient portfolios.
Next, we will use optimizers provided by numpy and find the Global Minimum Variance (GMV) portfolio.
Data Collection
As always, we set the ground work needed to fetch some stock data.
Package Installation
%%capture
%pip install yahoofinancials
from yahoofinancials import YahooFinancials
import pandas as pd
import matplotlib
import matplotlib.pyplot as plt
import dateutil.parser
import numpy as np
STOCK_SYMBOLS = ['MSFT', 'APT']

def retrieve_stock_data(symbol, start, end):
    '''
    Fetches daily stock prices from Yahoo Finance
    '''
    json = YahooFinancials(symbol).get_historical_price_data(start, end, "daily")
    df = pd.DataFrame(columns=["adjclose"])
    for row in json[symbol]["prices"]:
        d = dateutil.parser.isoparse(row["formatted_date"])
        df.loc[d] = [row["adjclose"]]
    df.index.name = "date"
    return df

def arithmetic_rets(S):
    '''Returns the arithmetic returns. (price_today - price_yesterday)/price_yesterday'''
    return S.pct_change().dropna()

def annualize_rets(r, periods_per_year):
    compounded_growth = (1+r).prod()
    n_periods = r.shape[0]
    return compounded_growth**(periods_per_year/n_periods)-1

def portfolio_return(weights, returns):
    return weights.T @ returns

def portfolio_volatility(weights, covariance_matrix):
    return (weights.T @ covariance_matrix @ weights)**0.5

def generate_returns_dataframe(symbols_list, d_from="2020-01-01", d_to="2021-01-01"):
    '''
    Generates a DataFrame with daily returns for a list of Symbols.
    '''
    returns = pd.DataFrame()
    for symbol in symbols_list:
        stock_prices = retrieve_stock_data(symbol, d_from, d_to)
        rets = arithmetic_rets(stock_prices).dropna()
        rets.columns = [symbol]

        if returns.empty:
            returns = rets
        else:
            returns = returns.merge(rets, left_index=True, right_index=True)
    return returns
returns = generate_returns_dataframe(STOCK_SYMBOLS)
returns.head(5)
| MSFT | APT | |
|---|---|---|
| date | ||
| 2020-01-03 | -0.012452 | 0.005780 |
| 2020-01-06 | 0.002585 | 0.008621 |
| 2020-01-07 | -0.009118 | 0.000000 |
| 2020-01-08 | 0.015928 | -0.002849 |
| 2020-01-09 | 0.012493 | 0.000000 |
Volatility Minimization
The data we collected above is the same as Return & Volatility of a Multi-Asset Portfolio, and the purpose is to find the weights that minimize the volatility of the portfolio. As we saw from the graph in the previous article, the weights should be somewhere close to [0.89, 0.11].
For example, given weights [0.5, 0.5], the portfolio return is:
portfolio_return(np.array([0.5, 0.5]), annualize_rets(returns, 252)) - 1
0.3109859252509841
To avoid a brute-force approach with trying different weights and getting the ones that give the minimum volatility, we can use algorithms that do this for us. Algorithms like Sequential quadratic programming which based on the amount of constraints performs different levels of differentiations with purpose to minimize a cost function. In general, the objective function which in our case is the Efficient Frontier, has a point where the tangent either gets 0 or 1. In our case the tangent should be 1. The algorithm iteratively walks through the objective function, finds the tangent, and applies the constraints. Of course, like any cost function optimization in Machine Learning the accuracy is not always 100%! The algorithm may get stuck in local minima and not be able to find the best result. However, in the case of Efficient Frontier, the objective function has only one minimum and thus makes it easier to find.
Let's apply the algorithm on our data. The only constraints we provide for now is that the sum of the weights must be equal to 1.
from scipy.optimize import minimize
n = len(STOCK_SYMBOLS)
cov = returns.cov()
weights_sum_to_1 = {
    'type': 'eq',
    'fun': lambda weights: np.sum(weights) - 1
}
result = minimize(portfolio_volatility, np.repeat(0, n), args=(cov, ),
                  method="SLSQP", options={'disp': False},
                  constraints=(weights_sum_to_1), bounds=((0.0, 1.0),)*n)
result.x
array([0.89906844, 0.10093156])
The portfolio that produces the minimum risk for an investor is called Global Minimum Variance (GMV) portfolio and lies at the far left of the Efficient Frontier.
In a next article we will go one step further in the Efficient Frontier analysis and try to find other points in the graph that are of interest.
Stay tuned!

