Inflation - Looking Back!
June 8, 2021 by Chris
 python
In Present Value & the Funding Ratio we picked a static annual inflation rate to plan the financing of future expenses. In this article we will use the inflation historical data to determine how inflation had affected our savings.
Package Installation
%%capture
import pandas as pd
import numpy as np
from datetime import datetime
from dateutil.relativedelta import relativedelta
import matplotlib.pyplot as plt
!pip install -q requests
!pip install -q pyscbwrapper
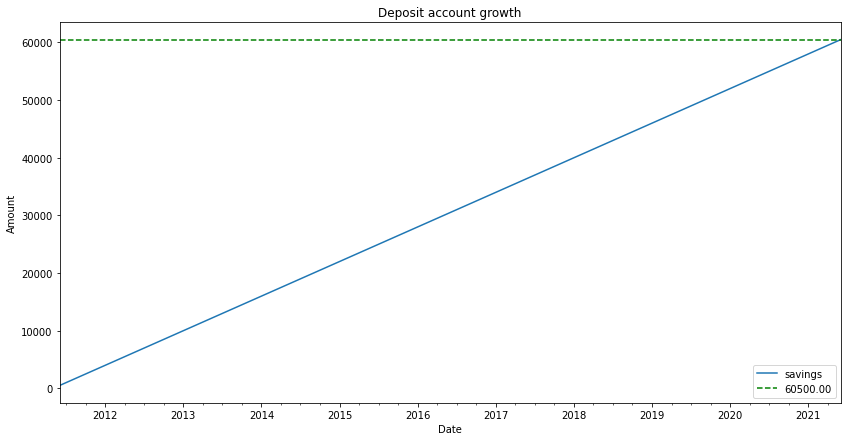
Let us assume that 10 years ago a person started depositing 500$ of hers/his salary to the bank once a month.
SAVINGS_PER_MONTH = 500
def generate_montly_savings_account_balance(monthly_savings):
  today = datetime.today()
  beginning_of_month = datetime(today.year, today.month, 1)
  ten_years_ago = beginning_of_month - relativedelta(years=10)

  savings_df = pd.DataFrame({
      'date': pd.date_range(start=ten_years_ago, end=beginning_of_month, closed=None, freq='MS'),
      'savings': monthly_savings
      })
  savings_df = savings_df.set_index(['date'])
  return savings_df

savings_df = generate_montly_savings_account_balance(SAVINGS_PER_MONTH)
savings_accumulated = savings_df.savings.cumsum()
current_total = savings_accumulated[savings_df.index[-1]]
savings_plot = savings_accumulated.plot(figsize=(14,7))
savings_plot.set_title('Deposit account growth')
savings_plot.set_xlabel('Date')
savings_plot.set_ylabel('Amount')
savings_plot.axhline(current_total, color='g', linestyle='--', label='{:0.2f}'.format(current_total))
savings_plot.legend()
plt.show()
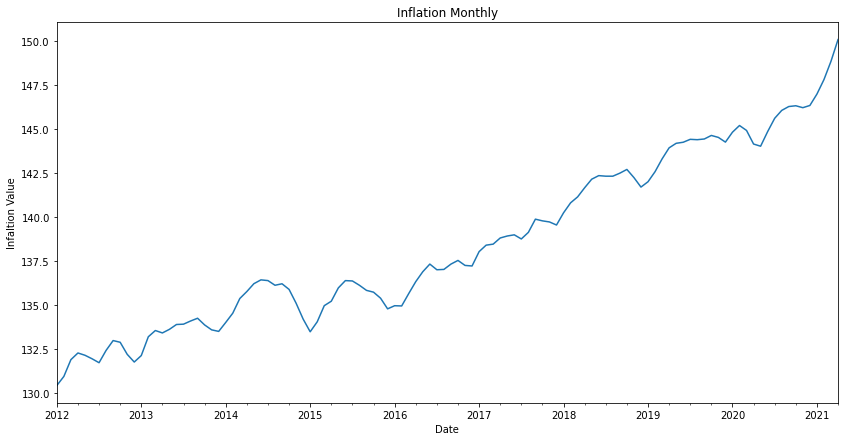
Next, let's fetch the US inflation rates from the U.S. BUREAU OF LABOR STATISTICS and see how it advanced over the last decade.
def get_us_cpi(start_year='2012', end_year = '2021'):
  '''
    from https://www.bls.gov/developers/api_python.htm#python1
  '''
  import requests
  import json
  headers = {'Content-type': 'application/json'}
  data = json.dumps({"seriesid": ['SUUR0000SA0'],"startyear":start_year, "endyear":end_year})
  p = requests.post('https://api.bls.gov/publicAPI/v1/timeseries/data/', data=data, headers=headers)
  json_data = json.loads(p.text)
  cpi_list = []
  for series in json_data['Results']['series']:
    seriesId = series['seriesID']
    for item in series['data']:
      year = item['year']
      period = item['period']
      value = item['value']

      if 'M01' <= period <= 'M12':
        datetime_object = datetime.strptime('{}-{}-01'.format(year, period[1:]), '%Y-%m-%d')
        value = float(value)
        cpi_list.append({
                    'date': datetime_object,
                    'cpi':  0.001 if value == 0.0 else value
                  })
  cpi= pd.DataFrame(cpi_list)
  cpi['date'] = cpi['date'].astype('datetime64[ns]')
  cpi = cpi.set_index('date')
  cpi = cpi.sort_values(by='date')
  return cpi

us_cpi = get_us_cpi()
inflation_rate_change_plot = us_cpi['cpi'].plot(figsize=(14,7))
inflation_rate_change_plot.set_title('Inflation Monthly')
inflation_rate_change_plot.set_xlabel('Date')
inflation_rate_change_plot.set_ylabel('Infaltion Value')
plt.show()
We will now see how inflation would affect the purchase value of 1$. To do that we will calculate the monthly percentage change and then create what we previously referred to as wealth index of 1$.
def plot_cpi_on_unit(cpi, unit='$'):
  if 'pct_change' not in cpi.columns:
    cpi['pct_change'] = cpi['cpi'].pct_change().dropna()
  change_on_unit = 1 * (1+cpi['pct_change'][savings_df.index[0]:]).cumprod()
  change_on_unit_plot = change_on_unit.plot(figsize=(14,7))
  change_on_unit_plot.set_title(f"How Inflation affects 1 {unit}")
  change_on_unit_plot.set_xlabel('Date')
  change_on_unit_plot.set_ylabel(f"Worth of 1 {unit}")
  change_on_unit_plot.axhline(change_on_unit[-1], color='g', linestyle='--', label='{:0.2f}'.format(change_on_unit[-1]))
  change_on_unit_plot.legend()
  plt.show()

plot_cpi_on_unit(us_cpi, unit='$')
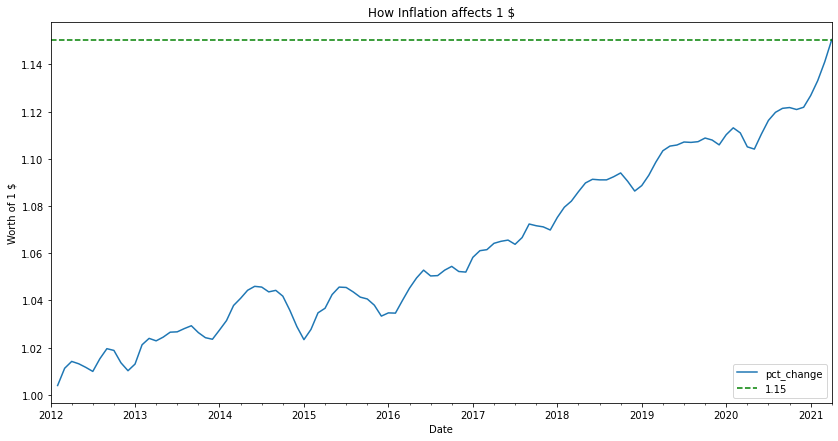
What the graph shows above is that buying a product at 1$ in the beginning of 2012, this exact same product would today cost 1.15$. If you had saved the dollar in an account you would today miss 0.15$ to be able to purchase the product. In practice, you have lost 0.15$!
Now that we have the percentage changes of the inflation, lets calculate the total loss of our savings all these years. For each month we add money to the cash account we have to start measuring the impact of inflation from that point on.
def plot_loss_on_savings(savings, cpi):
  last_valid_index = cpi.last_valid_index()
  s = pd.DataFrame(columns=savings.index.array, index=savings.index)
  for col in s.columns:
    wealth_index = savings['savings'][col] * (1+cpi['pct_change'][col:last_valid_index]).cumprod()
    s[col] = wealth_index - savings['savings'][col]
  inf_losses = s.sum(axis=1)
  ax = inf_losses.plot(figsize=(14,7))
  ax.set_title('Total loss due to inflation')
  ax.set_xlabel('Date')
  ax.set_ylabel('Loss in $')
  ax.axhline(inf_losses[last_valid_index], color='r', linestyle='--', label='{:0.2f}'.format(inf_losses[last_valid_index]))
  ax.legend()
  ax.plot()

plot_loss_on_savings(savings_df, us_cpi)
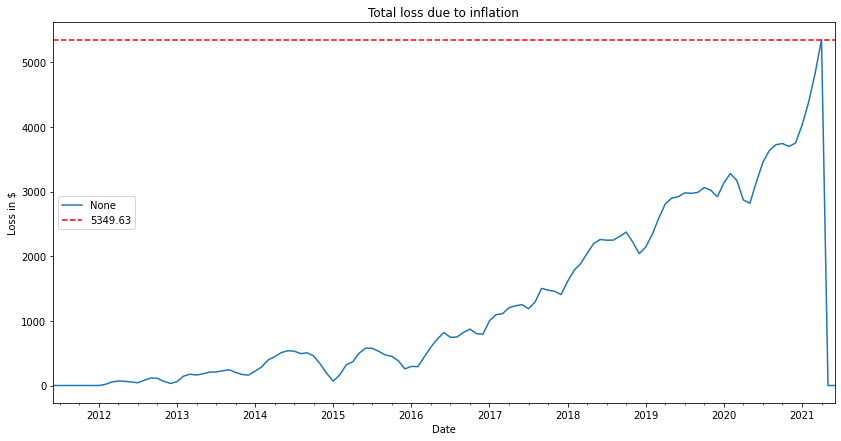
5349$ is the loss of saving in the bank without investing. That is almost 10% of the total account value!
Sweden
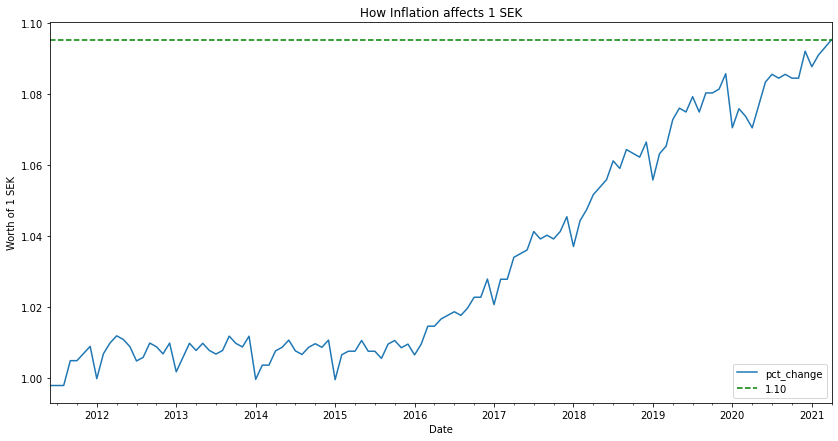
Having a special interest in the Swedish market, I will include the code needed to fetch inflation statistics from SCB.
def get_swedish_cpi():
  """ Returns the CPI as a monthly percentage change.
  For more information: https://github.com/kirajcg/pyscbwrapper/blob/master/pyscbwrapper.ipynb
  """
  import re
  from pyscbwrapper import SCB
  scb = SCB('en', 'PR', 'PR0101', 'PR0101A', 'KPIFFMP')
  scb.set_query(month=scb.get_variables()['month'])
  data = scb.get_data()['data']
  my_list = []
  for obj in data:
    date_scb_formatted = obj['key'][0].strip()  # this looks like '2020M06'
    year_month_search = re.search('^(\d{4})M(\d{2})$', date_scb_formatted)
    datetime_object = datetime.strptime('{}-{}-01'.format(year_month_search.group(1), year_month_search.group(2)), '%Y-%m-%d')
    my_list.append({'date': datetime_object,
                    'pct_change': float(obj['values'][0])/100
                    })
  cpi= pd.DataFrame(my_list)
  cpi = cpi.set_index('date')
  return cpi

sw_cpi = get_swedish_cpi()

plot_cpi_on_unit(sw_cpi, unit='SEK')