Home > Mathematics >
Measures of Variability
November 1, 2020 by Chris
 statistics
Measures of location cannot identify how well average, mode, etc. represent the data. They fail to answer questions like:
- How close are the values to each other?
- What is the largest difference between the values?
- On average, how far are the values from each other?
Measures of variability (also called spread) fill this gap. The most common are:
- Standard Deviation (SD)
- Range, which is the largest value minus the smallest value
- Interquartile Range (IQR) which is the upper quartile (75th percentile), minus the lower quartile (25th percentile)
In investing, Standard Deviation is one of the most common methods for determining the risk of an investment (also called volatility).
Variance ( or ) & Standard Deviation ()
Variance is the average squared difference from the mean, or alternatively, how spread out the data are around their mean.
Note: We can divide by n or n-1. n is the total population of an event. n-1 a series of it. numpy is, by default, using n-1! The difference is negligible for long sequences, but not for short ones!
We see above that, for some reason, we squared the difference (), instead of just taking the absolute difference (). We did that in order to avoid the same problem we have with the mean, where the sum can be zero because of negative values in the list. Imagine, for example, having the sequence -10,1,2,3,4. What is the mean value? 0! And, how spread are the data around the mean? 0 again. It doesn't really make much sense, right? By observing the sequence, we see that there is some spreading of the data around "something". This, "something" doesn't feel to be 0. It feels like something close to the 1,2,3,4 values, which look like a group of values that are really close to each other. I know that is kinda difficult to grasp. But, not until we raise it to another "dimension" :). And that is what we do when we square the values.
- we remove the negative sign
- we make the values that are far from "the group", to stand out (the outliers are emphasized).
- we change the unit of measurement (it is now something much bigger). Like another dimension!
To return back to the unit we started with, but meanwhile keep the notion of spreading, we use the RMS (Root Mean Square) of all the distances to the mean. We call that Standard Deviation (SD):
Standard Deviation in Investing
Standard Deviation measures the volatility of an asset. Large values mean that the asset's price can diverge a lot from the mean value. Thus, an indication of higher risk. On the flip side, low volatility may indicate low risk.
A critical point to remember is that standard Deviation is a backward looking tool and not a guarantee of future moves.
While daily returns (usually log returns) of an asset are more like leptokurtotic distributions (i.e. exhibit fat tails), we can add some abstraction by saying that are normally distributed (not to measure actual risk, but to get an initial approximation of risk).
Normal distributions have some very unique attributes. The most important are:
- The center of a normal distribution is located at its peak, and 50% of the data lies above the mean, while 50% lies below. The mean, median, and mode are all equal
- Approximately 68% of the data lies within 1 SD of the mean, Approximately 95% of the data lies within 2 SD of the mean, Approximately 99.7% of the data lies within 3 SD of the mean. This is known as
The empirical rule.
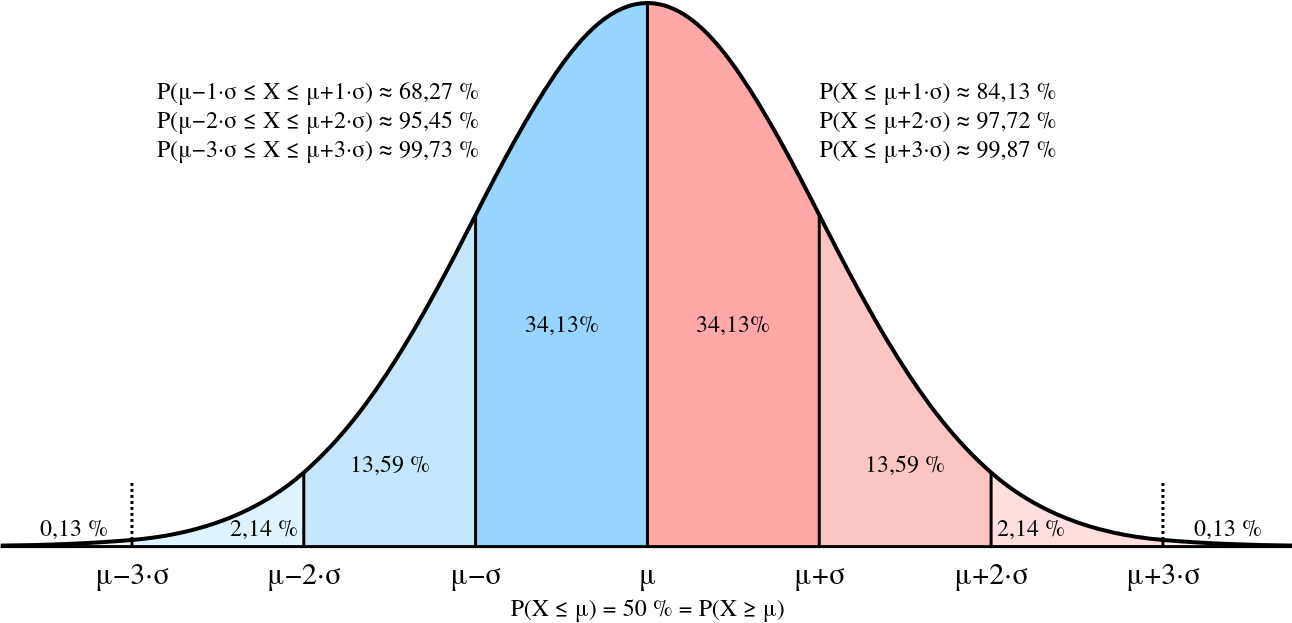
Let's assume that the average price of an asset is 40$ (measured with daily returns for some period) and the standard deviation is 5$. We can assume with 95% certainty the next closing price remains between 30$ and 50$! (More on that in a later post). In other words, we are 95% sure that the max loss will not exceed 10$.
Standard Deviation is considered a pure measure of risk (due to returns distribution deviate from the normal one), but is a good indicator of how volatile as asset is.
Percentiles
We find the percentile by ordering all the values in a dataset from smallest to largest. Then we multiply the number of values by the percentile we want. This, will give us the index of this percentile in the dataset. The value at this index is the requested percentile.
For example, suppose you have 12 daily stock return, ordered from lowest to highest: 2.3, 2.7, 3.1, 3.5, 3.9, 4.6, 4.7, 5, 5.1, 5.2, 5.4, 9. To find the 90th percentile for these (ordered) returns, start by multiplying 90% times the size of the dataset, which gives 90% * 12 = 0.90 * 12 = 10.8 (the index). Rounding up to the nearest whole number, you get 11.
Counting from left to right (from the smallest to the largest value in the dataset), you go until you find the 11th value in the dataset. That value is 5.4, and it’s the 90th percentile for this dataset.
Someone can think of the percentile as a lower dimension of the quantile. And the quartile a lower dimension of the percentile. This, because a quantile (which spans to any type of quantity) can take any upper value (like ex. 1500). The percentile (cent=100) is bound between 0-100. And the quartile (quarter) bound between 1-4.
Thus:
- The 25th percentile is also called the first quartile.
- The 50th percentile is generally the median.
- The 75th percentile is also called the third quartile.
- The difference between the third and first quartiles is the interquartile range.
Percentiles in Investing
A simple example of how percentiles can be used in Investing was introduced in the previous section, where we asked, how sure we were that a loss will not exceed a value. Questions like that can be asked in numerous ways, and in the majority of the cases involve some sort of percentile representation.

